Canva Overview
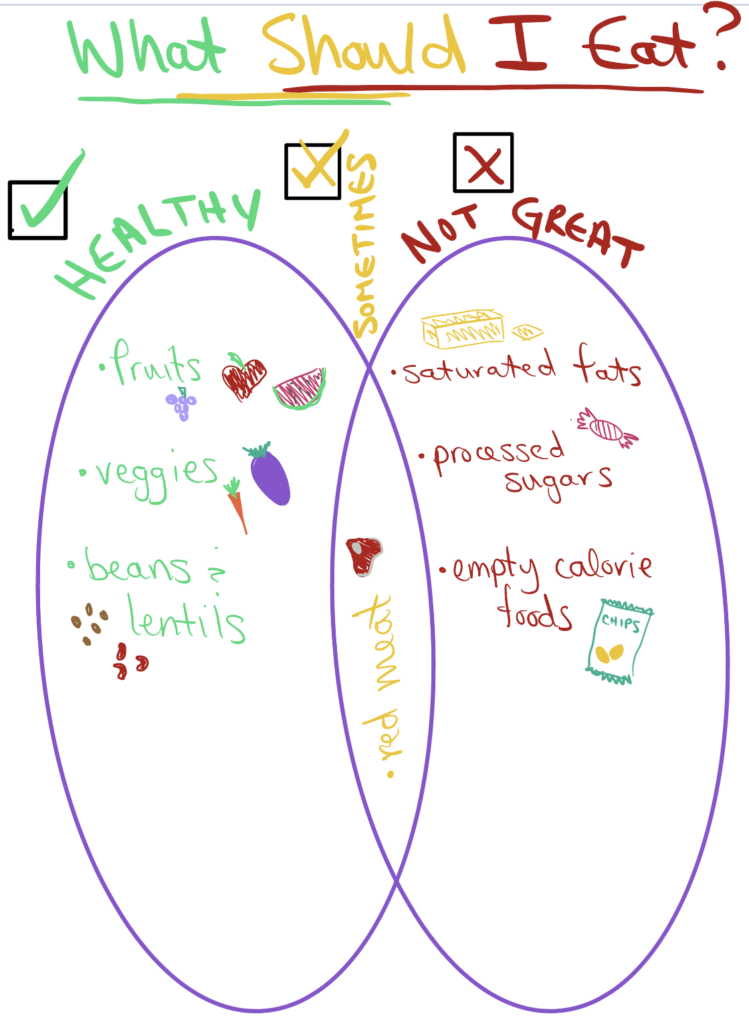
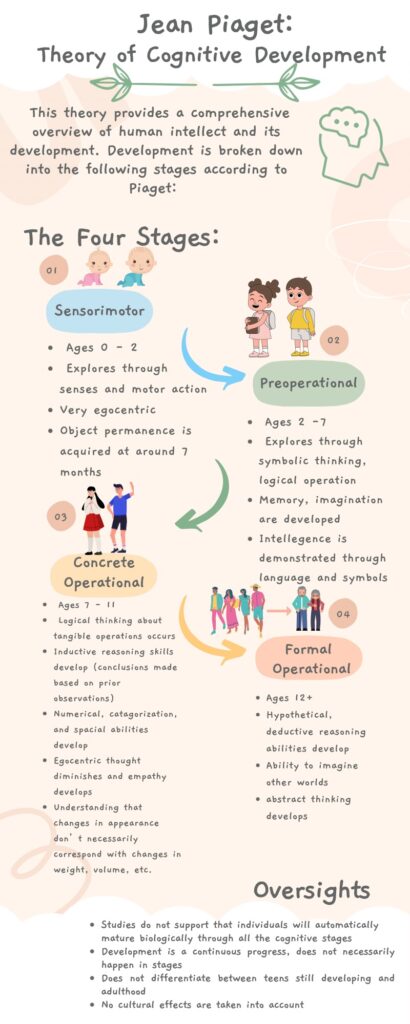
Canva is a graphic design program that is free to download and includes tons of templates for posters, slideshows, or anything you need to present visually. I find Canva to be an extremely easy program to operate and useful for creating educational materials. It is my favourite way to make infographics which I use for studying and presentation purposes.
For younger students this is a great way for their teacher to create instructions that include words and pictures. For older students this is a way to practice summarizing their learning and course information, or to create their own visual presentations.
Although your students have to access a computer or tablet and internet to use this resource, I think it is very valuable for students in grades 3 and up. Most schools have access to some sort of computer lab or class sets of laptops and I feel like is an intentional way to use those resources. An infographic is a great way to receive summative assessments from your students to easily view their understanding of a topic, and Canva being easy to use makes the technology usage an easy barrier for them to cross.
amacdonell
February 14, 2023 — 1:01 pm
Hey Steph,
I like how you discussed how Canva could be used with different age groups in the school system! I wonder if you could have dug into the negatives of Canva a little more. Other than that, I appreciate your concise review of Canva.